Pepper Plants
Screen 9 – Results: Evaluate the Fertilizers
Screen 9 presented the results of the student’s seedling growth in each of the three tanks based on the student’s choices of fertilizer and water. The students were reminded that number of flowers on a plant is good indicator of potential pepper production. Then they were asked to interpret their results about the effectiveness of Fertilizer A and Fertilizer B.
Click video to play
Maximum Score Points: 1
Content Domain: Biology
Topic Area: Life Cycles, Reproduction, and Heredity
Cognitive Domain: Reasoning
Science Practice: Answering the Research Question
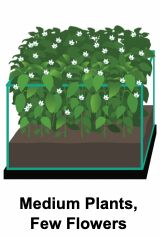
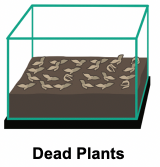
Each student’s three growth tanks showed plants of various heights and number of flowers based on the student’s own particular fertilizer set up. The plants given either 300 or 600 ml of water had the same growth, but those with 0 water withered and died. When students saw their results on Screen 9, they were able to change their experimental setup in an effort to improve their results. Interestingly, analyses of the process data indicated that after seeing Screen 9, on average across countries, 29 percent of the students went back and made changes to both their fertilizer and water settings and another 1 percent adjusted their fertilizer settings.
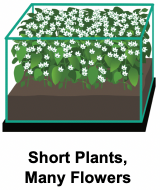
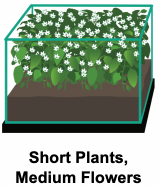
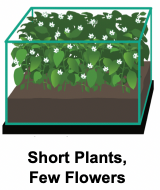
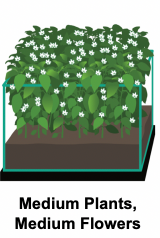
The different results derived from the different possible settings for a tank are shown below in Exhibit 49.
Exhibit 49: Pepper Plants Screen 9 – Possible Results for a Growth Tank

Results
Exhibit 50 shows the percentage of students responding correctly to Screen 9. A correct response was based on a correct experimental setup (from Exhibit 43, Screen 4) and the student selecting “Fertilizer A” as the better fertilizer because it produced the largest number of flowers. As an authentic activity, it was interesting to ask students to interpret the results of their own experiment. However, it was not a good measure of their interpretive skills because this depended on having designed a fully correct experiment—something achieved only by 15 percent of the students on average across countries (see Exhibit 43). As might have been anticipated, nearly all of the students who designed a fully correct experiment were able to interpret their own results (13% on average across countries). On average girls had somewhat higher performance than boys (14% vs. 12%).
Students who designed an incorrect experiment were unable to interpret their results in terms of the best fertilizer, but could select: “The results do not show which fertilizer is best for producing peppers.” Recognition of this also was “correct” in the sense that it was accurate, although these students had a different task than the students with correct results, and a number of different tasks among them depending on the particular flaws in their designs. On average across countries, 19 percent of students had incorrect experimental designs, and correctly selected not being able to say which was the best pepper producing fertilizer, with a correct explanation of why and a few more responded the same way based on incomplete experiments (2%). Larger percentages of students by far in the Russian Federation (65%) and the United States (58%) were able to recognize and describe the results of their incorrect setups as inconclusive than students in the rest of the countries (21% or fewer).