Automated Scoring with Neural Network Modeling
Introduction
The move to computer-based assessment of student achievement allows the implementation of more complex and innovative item types that capture responses and process indicators with greater nuance. The TIMSS 2019 PSI items were developed to assess students in integrated scenarios to better measure higher-order mathematics and science skills. While advanced constructed response items promise to improve measurement, they also typically require scoring by human raters, which can be costly. Some assessments have turned to automated scoring to reduce the workload associated with human scorers, including TIMSS for short open-ended responses that can be reliably machine scored. For example, the automated scoring of items that use number pad input has improved the efficiency of the data analysis process. It is desirable to extend automated scoring beyond short number-based responses to other constructed response types to continuously improve scoring reliability while reducing human rater workload and costs.
One complex item type that would benefit from automated scoring is graphical constructed response, which requires students to produce images or graphs. Developments in machine learning over the past decade have enabled algorithmic image classification, but this has yet to be utilized by any large-scale assessments. There is potential that implementing automated scoring of image-based responses improves scoring accuracy and comparability across countries by supplementing human ratings using machine approaches.
Automated Scoring of Response Images from PSI Item MQ12B03
To examine whether automated scoring could be implemented in a large-scale assessment, the TIMSS & PIRLS International Study Center conducted a study on response images from the Building PSI Task, Screen 4 – Constructing the Walls. This item asked students to draw a shed’s back and side walls on a grid according to given specifications. Students received full credit for drawing the back of the shed and its sides correctly and partial credit if only the back wall was correct; all other responses were considered incorrect. On average, about 26 percent of students received full credit on this item by drawing all three shapes correctly; about 11 percent received partial credit. See the Chapter 3 on the Building PSI task.
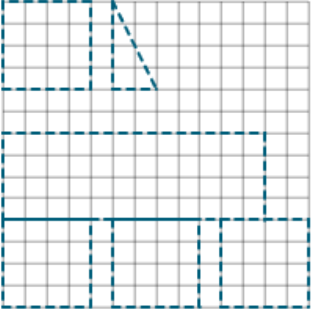
Most incorrect response images fell into three categories: blank, inaccurate shapes, and off task. Blank images were those where students had left the grid empty. For TIMSS 2019, these blank responses were automatically coded as “omitted” and were not seen by human scorers. Most of the response images contained inaccurate shapes where students had drawn shapes but did not have the correct dimensions to receive partial or full credit. Finally, off task images were those where students drew response images that were very different from the shed’s walls. Exhibit C.1 displays examples of incorrect responses.
Exhibit C.1: Examples of Incorrect Responses
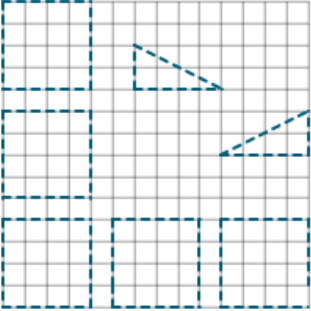 (inaccurate shape) |
 (inaccurate shape) |
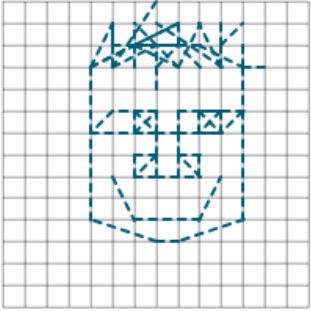 (off task) |
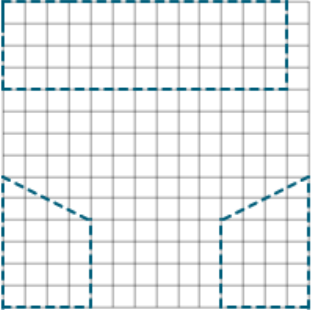
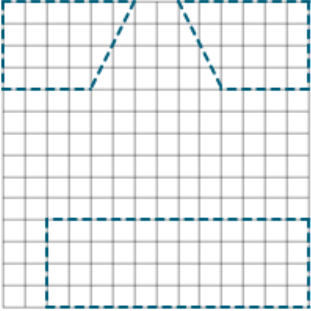
Response images given partial credit were not as diverse as incorrect responses, but they still varied from having only one shape (the back wall) to having multiple shapes. Exhibit C.2 exemplifies the variety of partial credit responses.
Exhibit C.2: Examples of Partial Credit Responses
 |
 |
 |
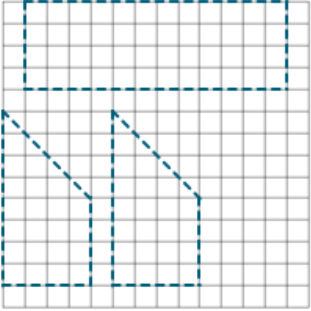
Response images given full credit tended to be more uniform than the other two score categories, but the orientation of the shapes differed between students. While the typical response had the shapes separated in the grid, some students attempted to conserve space on the board by having the shapes be as close together as possible. Also, response images wherein the grid’s border makes up one or more sides of the shape were still given full credit if the dimensions were correct. Exhibit C.3 includes examples of response images that received full credit.
Exhibit C.3: Examples of Full Credit Responses
 |
 |
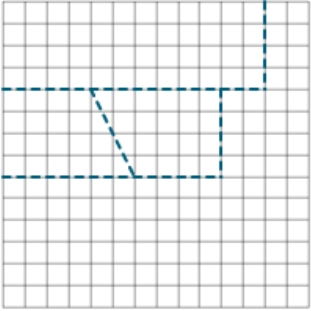 |
The diversity of the response images made this item an optimal candidate for examining whether automated scoring could be applied to complex graphical responses used in TIMSS assessment items. One challenge the responses present is that the back wall and sides of the shed can be in any orientation and still receive full credit, as long as the measurements are correct. Also, the algorithm must learn that blank, inaccurate, and off task response images all have the same classification (incorrect). Finally, the two-point nature of the item could present a challenge to the learning algorithm because it would have to distinguish between three categories instead of just two.
Assignment and Pre-Processing
For the study, 14,737 response images were extracted from the data of 22 participating countries, as well as 3 benchmarking participants with unique samples. Most benchmarking participants use the same student samples as their corresponding country participant, except for Moscow City, Russian Federation, Quebec, Canada, and Ontario, Canada. The response images and associated scores produced by human raters were analyzed without any identifying information.
The evaluation of image classification followed best practices customarily applied in machine learning: The response images were assigned to two samples—10,238 were used for the first (training) sample and 4,499 were used for the second (validation) sample. The automated scoring system would be trained to classify response images on the training sample and then test the accuracy of its classifications on the validation sample. This was done on a country-by-country basis, where roughly 70 percent of response images in each score category were randomly assigned to the training sample. The remaining response images were assigned to the validation sample (see Exhibit C.4). After assignment, the response images were converted to grayscale and had their contrast enhanced to distinguish the drawn lines from the grid.
Exhibit C.4: Response Image Sample Sizes
Neural Network Modeling and Results
The automated scoring process was conducted using machine learning with artificial neural networks (ANNs). This approach was selected because ANNs are flexible and are known to achieve high accuracy for image classification tasks. Additionally, ANNs are trained to classify images with little user interaction; instead, they automatically learn to identify specific features that are correlated with certain responses. For example, an ANN model may learn that lines at a 45-degree angle of a certain length are associated with full credit responses, while images with no lines are associated with incorrect responses. This study used a particular type of ANN known as a feedforward neural network (FFN). FFNs have a simpler structure than other, more complex neural networks, and move the input information layer by layer in only one direction, which reduces processing power and improves speed.1 More complex neural networks may include memory or feedback loops, or other structures, and are often used for sequence data or data that comes in more than two dimensions.2,3
The training of the FFNs and validation of the automated scoring approach was conducted in RStudio using the “Keras” package.4,5 The automated scoring models that were examined utilized varying numbers of processing layers, iterations of training, and optimizers (which maximize feature identification based upon different mathematical formulas—“Optimizers”6). In total, roughly 50 models were created and their accuracies compared to identify which model had the highest number of correct classifications.
The “best” model had a three-layer structure and underwent 300 iterations of training. It was also compiled using the “nadam” optimizer.7 This model had an accuracy of 90.35 percent and correctly classified 4,065 of the 4,499 response images in the validation sample.
This model had the most correct classifications for response images given full credit, with 94.74 percent accuracy. It correctly classified incorrect response images with 89.56 percent accuracy. However, the model only had 66.18 percent accuracy for partial credit response images. While this is noticeably lower, almost every model created in the process had the highest misclassifications for the partially correct score category. On a country-by-country basis, the models’ accuracy ranged from 83.89 to 96.94 percent. Variation in accuracies across countries is expected, and there were no discerning patterns of image misclassifications. On average, 17 response images were misclassified by the model per country.
Most of the images misclassified as incorrect by the best model were rectangles with no other shapes on the grid. It appears that the model associated response images that included both rectangles and other shapes with partial credit. Response images with rectangles that were too large or too small were sometimes misclassified as partial credit, while some response images with the sides of the shed correct or those with shapes similar to the sides of the shed were misclassified as full credit.
Implications for Future TIMSS Cycles
The most accurate automated scoring neural network from the study is comparable to the accuracy human scorers achieve. Additional explorations with other types of approaches may further improve accuracy. The benefit of using automated scoring with ANNs is that it is relatively fast and cost-effective. The Building PSI item used in the study did not have a second independent human rater for assessing the human scoring, thus the machine scoring functioned like a second human rater and showed a high level of agreement.
Future TIMSS cycles may utilize automated scoring with ANNs in place of a second human rater. Any disagreements between the primary human raters and the machine could be reviewed and resolved by an additional expert rater at the TIMSS & PIRLS International Study Center. This expert rater would only need to review a fraction of the responses that full-time raters would.
To utilize ANNs operationally for automated scoring, models could be trained on response images from past cycles or, for new items, on response images from the field test data collections. Then the most accurate model would be applied to the response images collected during the actual studies. It should be noted that while response sample sizes will be smaller from a field test than actual data collection, images can be transformed (e.g., rotated, flipped, and cropped) to increase the training data’s sample size.
Limitations
One limitation of using automated scoring with ANNs is that the training data must be accurate. Early in the study, it was found that some response images were scored incorrectly by human raters. Additionally, there were some scoring inconsistencies across countries, particularly for response images that had the shed’s walls with the correct dimensions but also included extraneous lines. These inconsistencies could be due to some raters giving students the benefit of the doubt more than others. Incorrect and inconsistently scored images were removed from the training and testing samples before the study began ANN modeling with all of the countries’ response images.
For future TIMSS cycles, training data must be carefully assessed so that incorrect and inconsistent response images are identified and re-scored. This process will likely require at least one additional human rater. However, the workload and associated cost would still be less than full sample double scoring by human raters to review every response image.
Notes
1 Svozil, D., Kvasnicka, V., & Pospichal, J. (1997). Introduction to multi-layer feed-forward neural networks. Chemometrics and Intelligent Laboratory Systems, 39(1), 43–62. https://doi.org/10.1016/S0169-7439(97)00061-0
2 Hochreiter, S., & Schmidhuber, J. (1997). Long short-term memory. Neural Computation, 9(8), 1735–1780. https://doi.org/10.1162/neco.1997.9.8.1735
3 von Davier, M. (2018). Automated item generation with recurrent neural networks. Psychometrika, 83, 847–857. https://doi.org/10.1007/s11336-018-9608-y
4 Chollet, F. (2017). Deep Learning with Python. Shelter Island, NY: Manning Publications.
5 Kalinowski, T., Allaire, J., & Chollet, F. (2021). R Interface to Keras. Keras. https://keras.rstudio.com/index.html
6 Keras. (2021). Optimizers. Keras API Reference. https://keras.io/api/optimizers/
7 Dozat, T. (2015). Incorporating Nesterov momentum into Adam. http://cs229.stanford.edu/proj2015/054_report.pdf